Интервью
некоторых исполнителей работ по GSHAP для журнала EOS:
New Map Lays Out Global Seismic Hazard Values (from EOS,
Volume 80, December 28, 1999).
The first-ever quantitative Global Seismic Hazard Map, issued on December
16, provides updated seismic hazard values for nearly half of the world's
nations. The map also adjusts hazard values along some politically charged
international boundaries where different methods for determining seismicity
had led to dissimilar values on either side of a border.
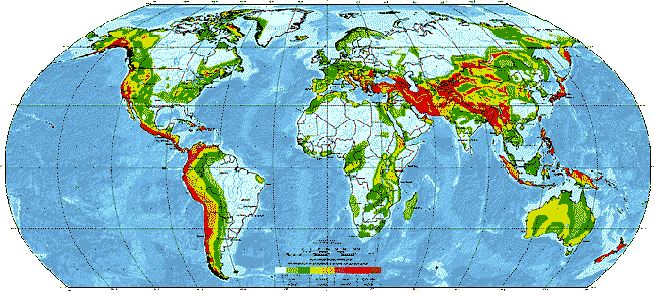
Eight percent of Earth's land mass falls within a range of high or very high
seismic hazard zones on the map. That hazard is defined as a 10% or greater
probability of violent shaking - which is 25% or more acceleration of
gravity - within the next 50 years. About 70% of the land mass lies in a low
hazard range.
Despite the small percentage of land located in high hazard zones, many of
the world's mega cities lie within red and brown bands on the map, which
indicate high and very high hazard levels. Within these bands are a number
of capital cities, including Caracas, Jakarta, Karachi, Katmandu, Istanbul,
Manila, and Mexico City. The red and brown swaths cover a number of areas,
including plate boundary regions along the Pacific rim from the Andes and
U.S. west coast to Japan, the Philippines, and New Zealand. Another high
hazard band stretches through parts of China, India, Iran, Turkey, and
Europe.
"What we have at risk is not only population, but we have the entire
functionality of the state, the government, and the economy," said Swiss
Seismological Service Director Domenico Giardini, coordinator for the Global
Seismic Hazard Assessment Program (GSHAP). The program produced the map as a
demonstration project of the United Nations International Decade of Natural
Disaster Reduction. That decade concludes on December 31.
While seismic hazard is significant, it does not necessarily translate into
seismic risk, Giardini added. Hazard refers to a probability of ground
shaking, and risk is a probability of damage that is obtained by combining
the vulnerability of buildings with seismic information. he explained.
"This map only provides part of the story. You could easily live in Taiwan
if you have a well-built house," he said, referring to a very high seismic
hazard location.
"We would suggest that you think about it if you are going to live anywhere
in the red or the brown zones," added Kaye Shedlock, a research
geophysicist with the U.S. Geological Survey (USGS) in Golden, Colorado, who
has served as GSHAP coordinator for the western hemisphere. She said people
in these zones should consider the types of buildings they construct there.
Shedlock declined to indicate exactly where in the world the greatest
seismic hazard exists. "Because seismic hazard calculations involve a
great deal of statistical manipulations, while I happen to know where the
single highest value on that map is, what's the point? There is an
uncertainty around it. So, by highlighting the very high hazard areas, we
are saying these essentially have comparable hazard. These are the places
you really want to think hard about living."
The map, which involved 500 scientists and engineers from around the world,
and took 7 years to complete, incorporates a number of existing country
maps. It includes data from seismic networks from around the world, global
positioning system and geodetic monitoring, paleoseismology studies and
geologic and tectonic framework studies, and historical catalogs from
China, Japan, and other regions. Even the Bible was consulted for
historical data.
Seismic instrumentation has improved significantly in recent years, but
relying only on newer measurements, and not on old catalogs, would not
account for some historically seismic areas where there may not have been
earthquakes during the past several hundred years, according to Giardini.
Since some countries measure seismicity differently, and there had not
previously been uniformly accepted standards to assess hazards, scientists
involved with the mapping project wrangled over a number of
issues - including how to describe ground motion and measure magnitudes,
where to indicate that seismic zone boundaries might or might not go, and
setting hazard values - to produce a map for improving seismic safety and
building codes.
The map measures peak ground acceleration (PGA), a common measurement of
ground shaking, and provides seismic values for every tenth of a degree in
every direction, which is about every 10 kilometers.
"For most countries in the world, new hazard maps are only produced when
you get a big earthquake, and you realize that your houses were not well
built," said Giardini.
For many countries, the GSHAP map marks a significant advance in determining
their seismic hazard values.
"All of the African rift never had any seismic hazard assessed, and the
hazard is quite high, actually," said Giardini. "For the first time, you
have eight countries which never had a hazard map now have an official
hazard map."
The map will alert countries to their vulnerability potential and should
trigger some policy position adjustments and provide justification for
better seismic monitoring networks both at national and regional levels,
according to Isaac Nyambok, professor of geology at the University of
Nairobi, Kenya, vice-president of the International Union of Geological
Sciences, and GSHAP coordinator for parts of Africa.
The map "provides a sound basis for earthquake risk
analysis for sub-Saharan
Africa," he said. "The map can also be used as a first step in natural
disaster mitigation and preparedness. It also broadly provides a basis for
designing suitable building codes of earthquake intensity in specific
regions. However, there are a few gaps in the data used which could have
been closed if there were adequate financial resources for the project.
"If the map is further improved with information on horizontal acceleration
and a larger scale used. it could form a basis of a legally binding
document. In its present form. it is mainly a guiding document," he said.
In Australia, a new map produced according to national and GSHAP standards
is colored primarily in swaths of green and yellow. which indicate low or
moderate seismic hazard. The result of the new product is that the
continent is now recognized to be more seismically active than it had been
believed to be, said Giardini.
"The map is basically that in our current code. What it does do is give us a
standard for comparison of the Australian hazard with that of the eastern
U.S. and Canada, Europe. and parts of China and Africa which have similar
tectonic settings. That allows us to compare our code practice with that of
other countries," said Kevin McCue of the Austraian Geological Survey
Organization. McCue. GSHAP coordinator for Australia, southwest Pacific, and
southeast Asia,
added, "my experience is that insurance rates won't change, though, if
building codes are followed in design and construction that equalize the
risk, then they should!"
"The GSHAP map is a unique hazard map since it has been prepared through
international cooperation using worldwide data, reliable data, and uniform
procedure," said Mohsen Ghafory-Ashtiany, president of the International
Institute of Earthquake Engineering and Seismology in Tehran, Iran, and
head of GSHAP's regional working group for the Middle East. "The
discrepancies that exist in the existing maps at the country's border have
been eliminated."
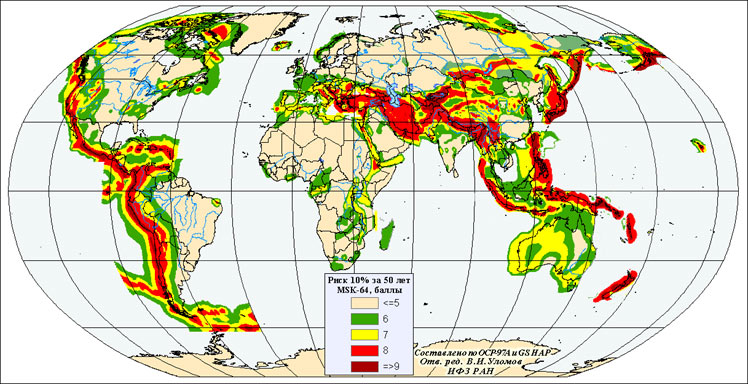
For Russia, which produced one of the world's first general seismic zoning
maps in 1937, the GSHAP world map has "mainly information significance,
because the building codes in our country use Seismic Zoning Maps
represented in the MSK-64 intensity scale (but not in PGA, as it is made in
GSHAP); said Valentin Ulomov, head of the Laboratory of Continental
Seismicity at the United Schmidt Institute of Physics of the Earth in
Moscow, and GSHAP coordinator for Russia and now for the former Soviet
Union.
Whole continents worked together on the map, but in some regions such as the
Middle East, where politics are particularly sensitive, the scientific
effort was more complicated.
Several years of effort were required to convince Turkey and Greece to
agree to a certain middle level for seismicity in the Aegean Sea, where
previously the level had varied just across borders.
And, three years of effort finally brought India and China - which share a
continent-to-continent collision zone boundary - to the same table, Giardini
said. The result, according to several sources, was that India, which had
lower hazard values prior to the mapping project, increased those values
along the border with China and in the northern part of the country, in
order to fit more closely with hazard values across the border in China. In
some areas in India, the hazard value was increased by as much as 40%, when
compared to a previous seismic study, one expert told Eos.
Modifications in hazard values may or may not generate internal political
pressure within a country to revise building codes, according to Gail
Atkinson, professor of Earth sciences at Canada's Carleton University in
Ottawa, Ontario. The seismic hazard map, Atkinson explained, is only one
input to what makes up a building code, and construction standards are also
important.
"People should look at the differences [in revised hazard values] and
understand the reasons for them and implications for the code," she said.
"But it doesn't necessarily follow that there are major changes required in
the code from the point of view of overall safety."
Terry Wallace, president of the Seismological Society of America, said that
miscalculating hazard values might place a government that has to modify
its values in a poor light and also have some economic implications.
"This match between India and China to some extent had to do with economic
development," Wallace said, referring to the modification of seismic
values in India.
He added that several of the required seismic hazard value changes on the GSHAP map were in developing nations that sometimes apply for loans from
the World Bank and other institutions that need accurate hazard
assessments.
"If you really modify your hazard values a lot, you need to immediately
reevaluate all the critical facilities that you have. And that might explain
the resistance in some places to really go out and play with the hazard. The
seismic hazard is the value that is really used for critical facilities,"
said Giardini. He said that separate seismic studies are required as part of
the planning and approval process for major infrastructure projects.
"As soon as you touch your hazard values a lot, you have to go out and check
if safety is still there or not," Giardini added. "India is in the process
now of checking what has to be reevaluated and what not, based on the new
hazard level."
Shedlock said it is difficult to know what impact revised hazard values
could have in different countries. "In our own country, high hazard values,
such as along the San Andreas fault system, have resulted in
seismically-resistant building practices," she said. "The degree to which
these practices are applied elsewhere are due to decisions made elsewhere."
"If it is a matter of raising India's level up, yes, it will affect a lot of
things there that are planned and existing along the Himalayan foothills,"
said Leonardo Seeber, a research scientist at the Lamont-Doherty Earth
Observatory of Columbia University in New York. Seeber said the Himalayan
region is one of the most dangerous places on the planet in terms of
earthquakes. He added that one positive aspect about the mapping project is
that it alerts people if there is a major hazards value mismatch in an area.
"I would use the mismatch and unearth any problems with basic data or
methodology," he said.
In the United States, new seismic hazard maps are required by law every 5
years, and the global project incorporates the USGS map. The United States
operates sophisticated equipment that can produce a reasonably good global
map, but by participating in this project the country not only gained a
better understanding of worldwide seismicity, but also gained access to a
global database and global analogs that are tectonically similar to U.S.
regions.
"Since the United States encompasses every major tectonic terrain, we now
have a far more complete database to look at our own parts of the country
through analogies to other parts of countries that have had their large
earthquakes during recorded history." said Shedlock.
"For the first time, we know where we stand globally. We have all been
familiar with the San Andreas fault here in California, and the very good
job Californians have done on the building codes. We now know how that
compares directly with the rest of the world."
The International Lithosphere Program was the driving force behind the
production of the map. with the assistance of a consortium of international
organizations and institutions that included UNESCO, International Council
of Scientific Unions (ICSU), European Council, USGS, Swiss Seismological
Survey, and World Meteorological Organization.
Poster sized copies of the map can be obtained through the USGS by sending
an e-mail with contact information to gshapmap@usgs.gov, and through the
Swiss Seismological Service by sending an e-mail to sed@seismo.ifg.ethz.ch.
For further information, visit the Web site: http://seismo.ethz.ch/GSHAP/.
Randy Showstack, Staff Writer